UtilityControl
AI-powered utility meter system for tracking usage and costs across multiple locations.
Watch UtilityControl in Action
See how UtilityControl makes utility meter tracking effortless. Complete demo showing web dashboard and iOS app features.
See UtilityControl in Action
Explore the powerful features that make UtilityControl the smart choice for utility management
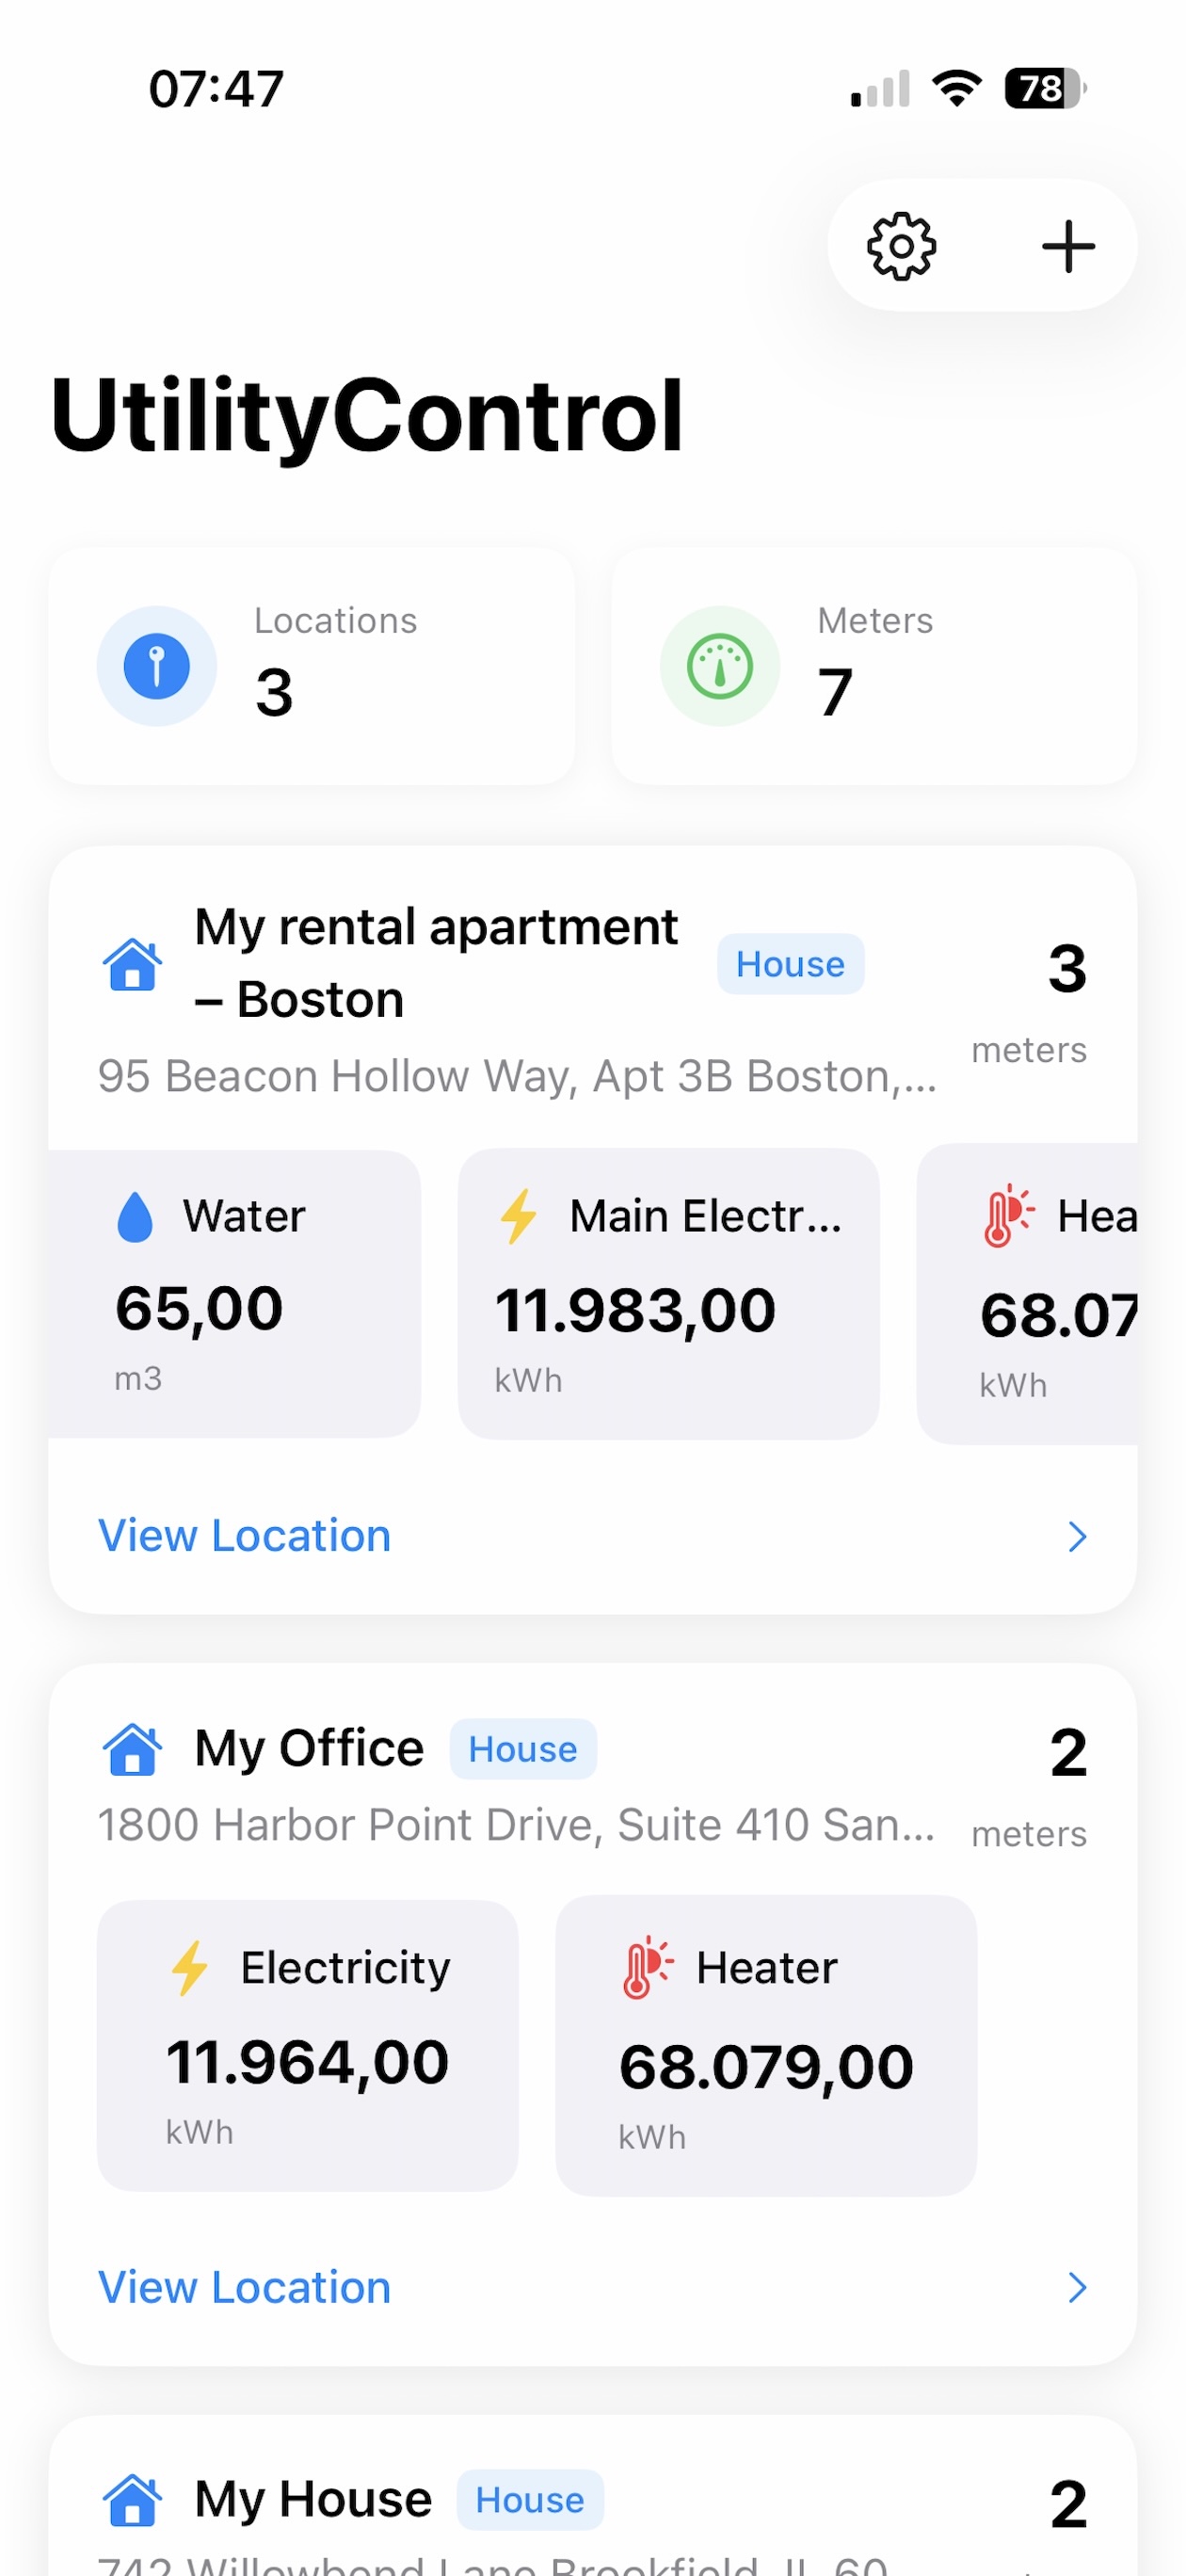
Organized Dashboard
Manage all your utility meters from one intuitive dashboard. Organize meters by location and track multiple properties effortlessly.
- ✓ View all locations and meters at a glance
- ✓ Quick access to meter details and recent readings
- ✓ Organize by property, building, or facility
- ✓ Track electricity, water, gas, heating, and more
- ✓ Seamless navigation across all your utilities
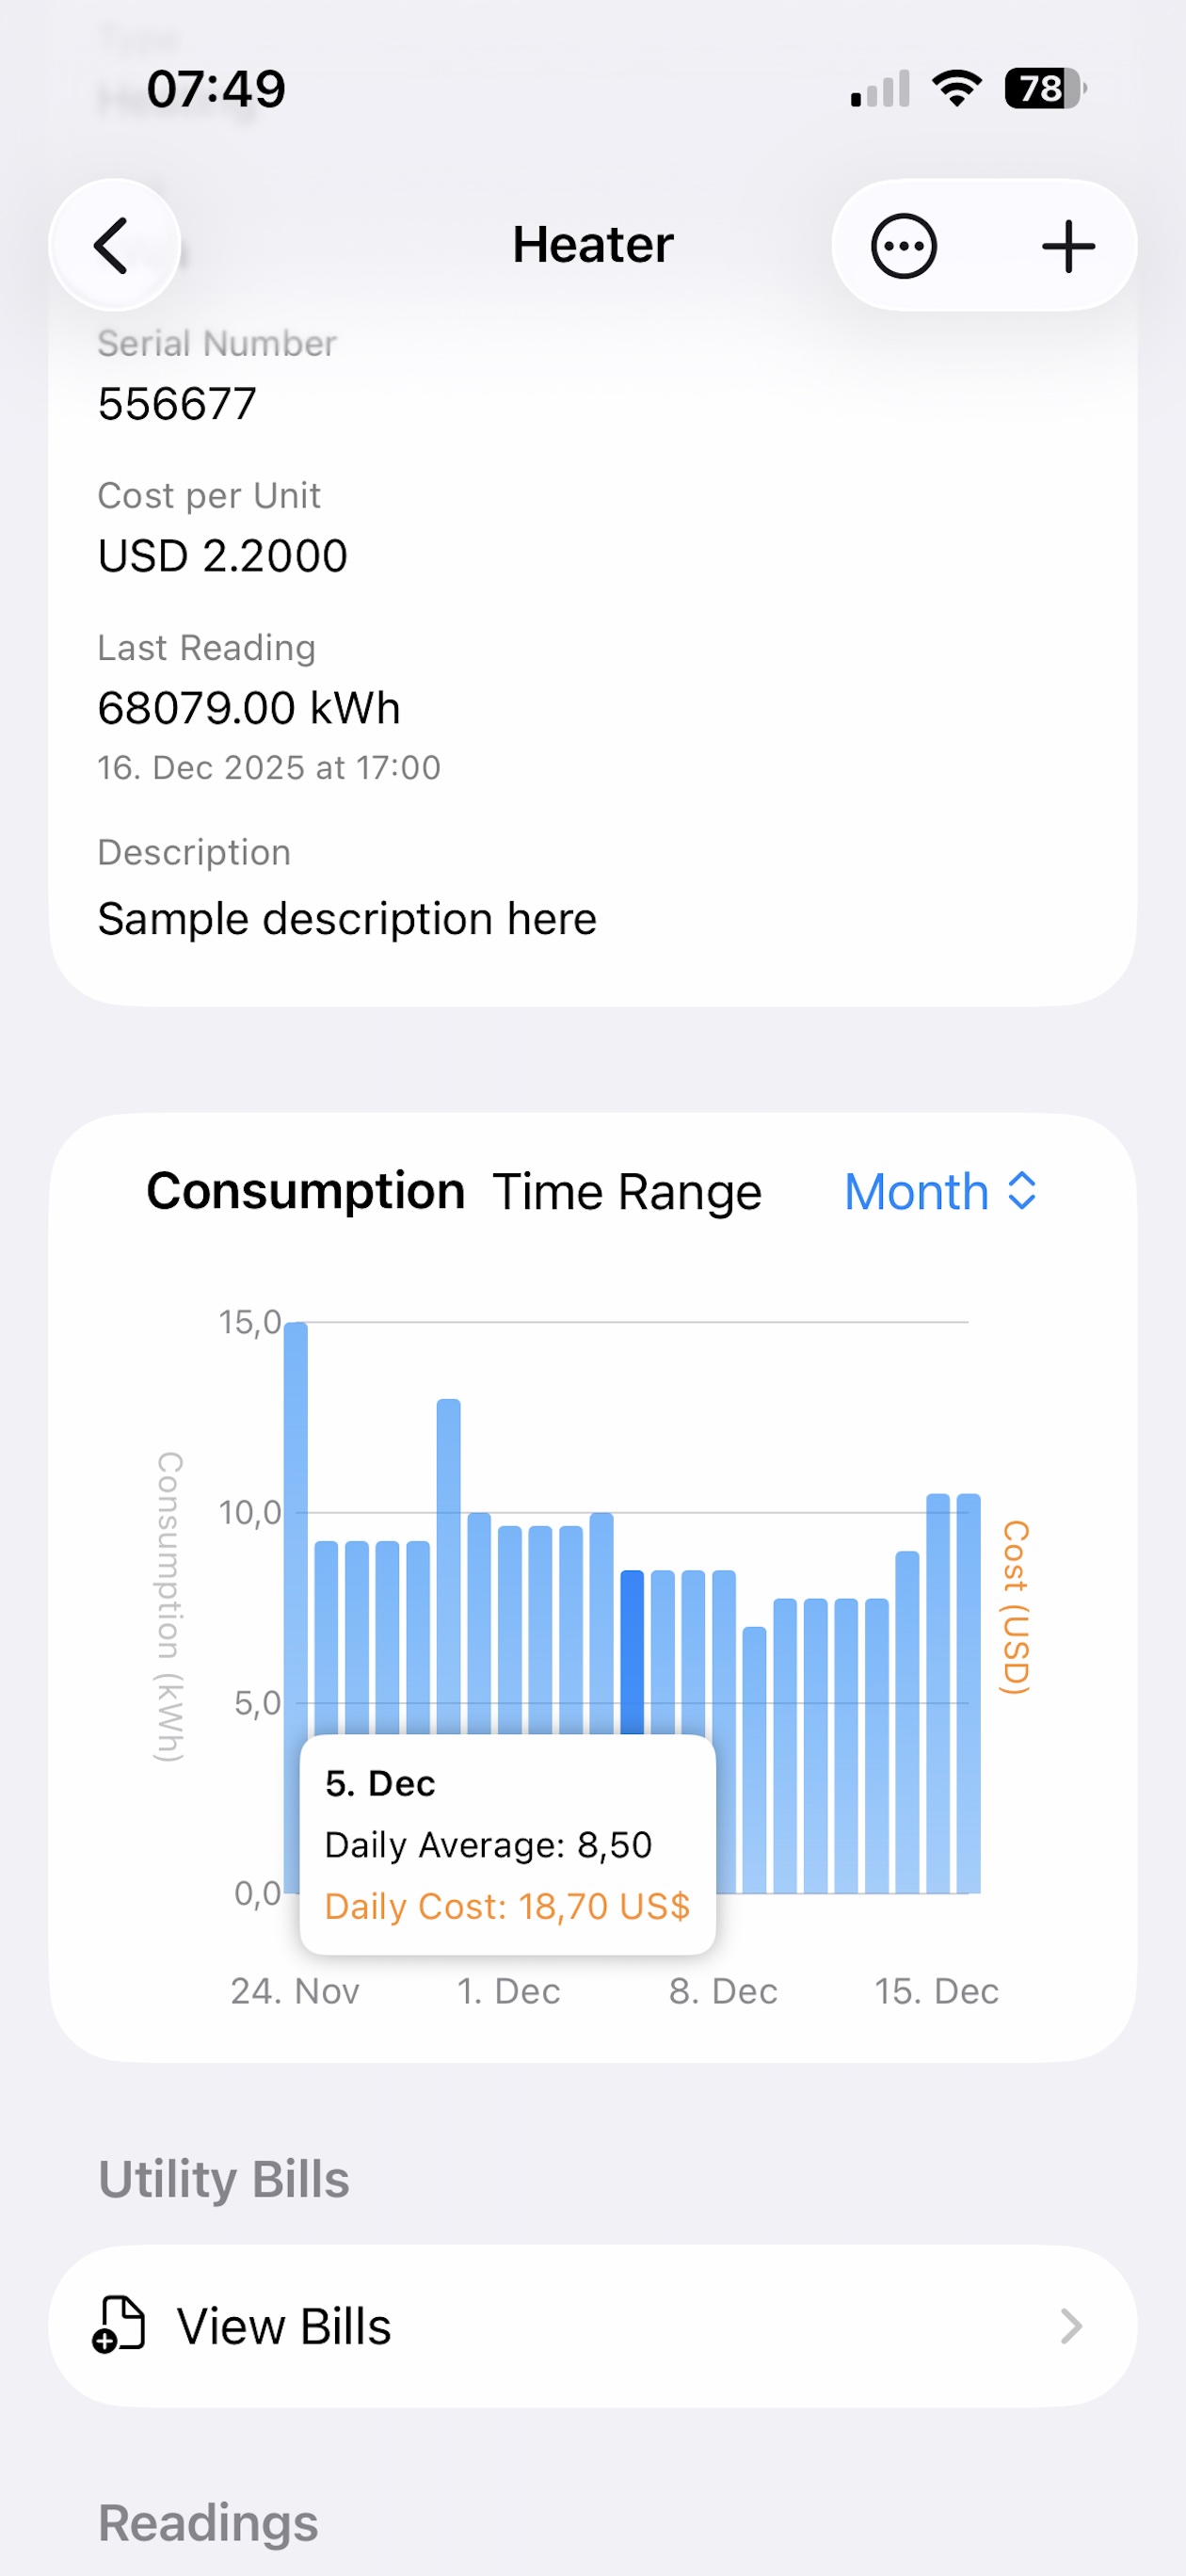
Visual Consumption Analytics
Interactive charts reveal your consumption patterns with automatic daily calculations and trend analysis.
- ✓ Daily consumption calculations with intelligent interpolation
- ✓ Interactive charts showing usage trends over time
- ✓ Filter by week, month, or custom date ranges
- ✓ Identify peak usage periods and anomalies
- ✓ Cost visualization alongside consumption data
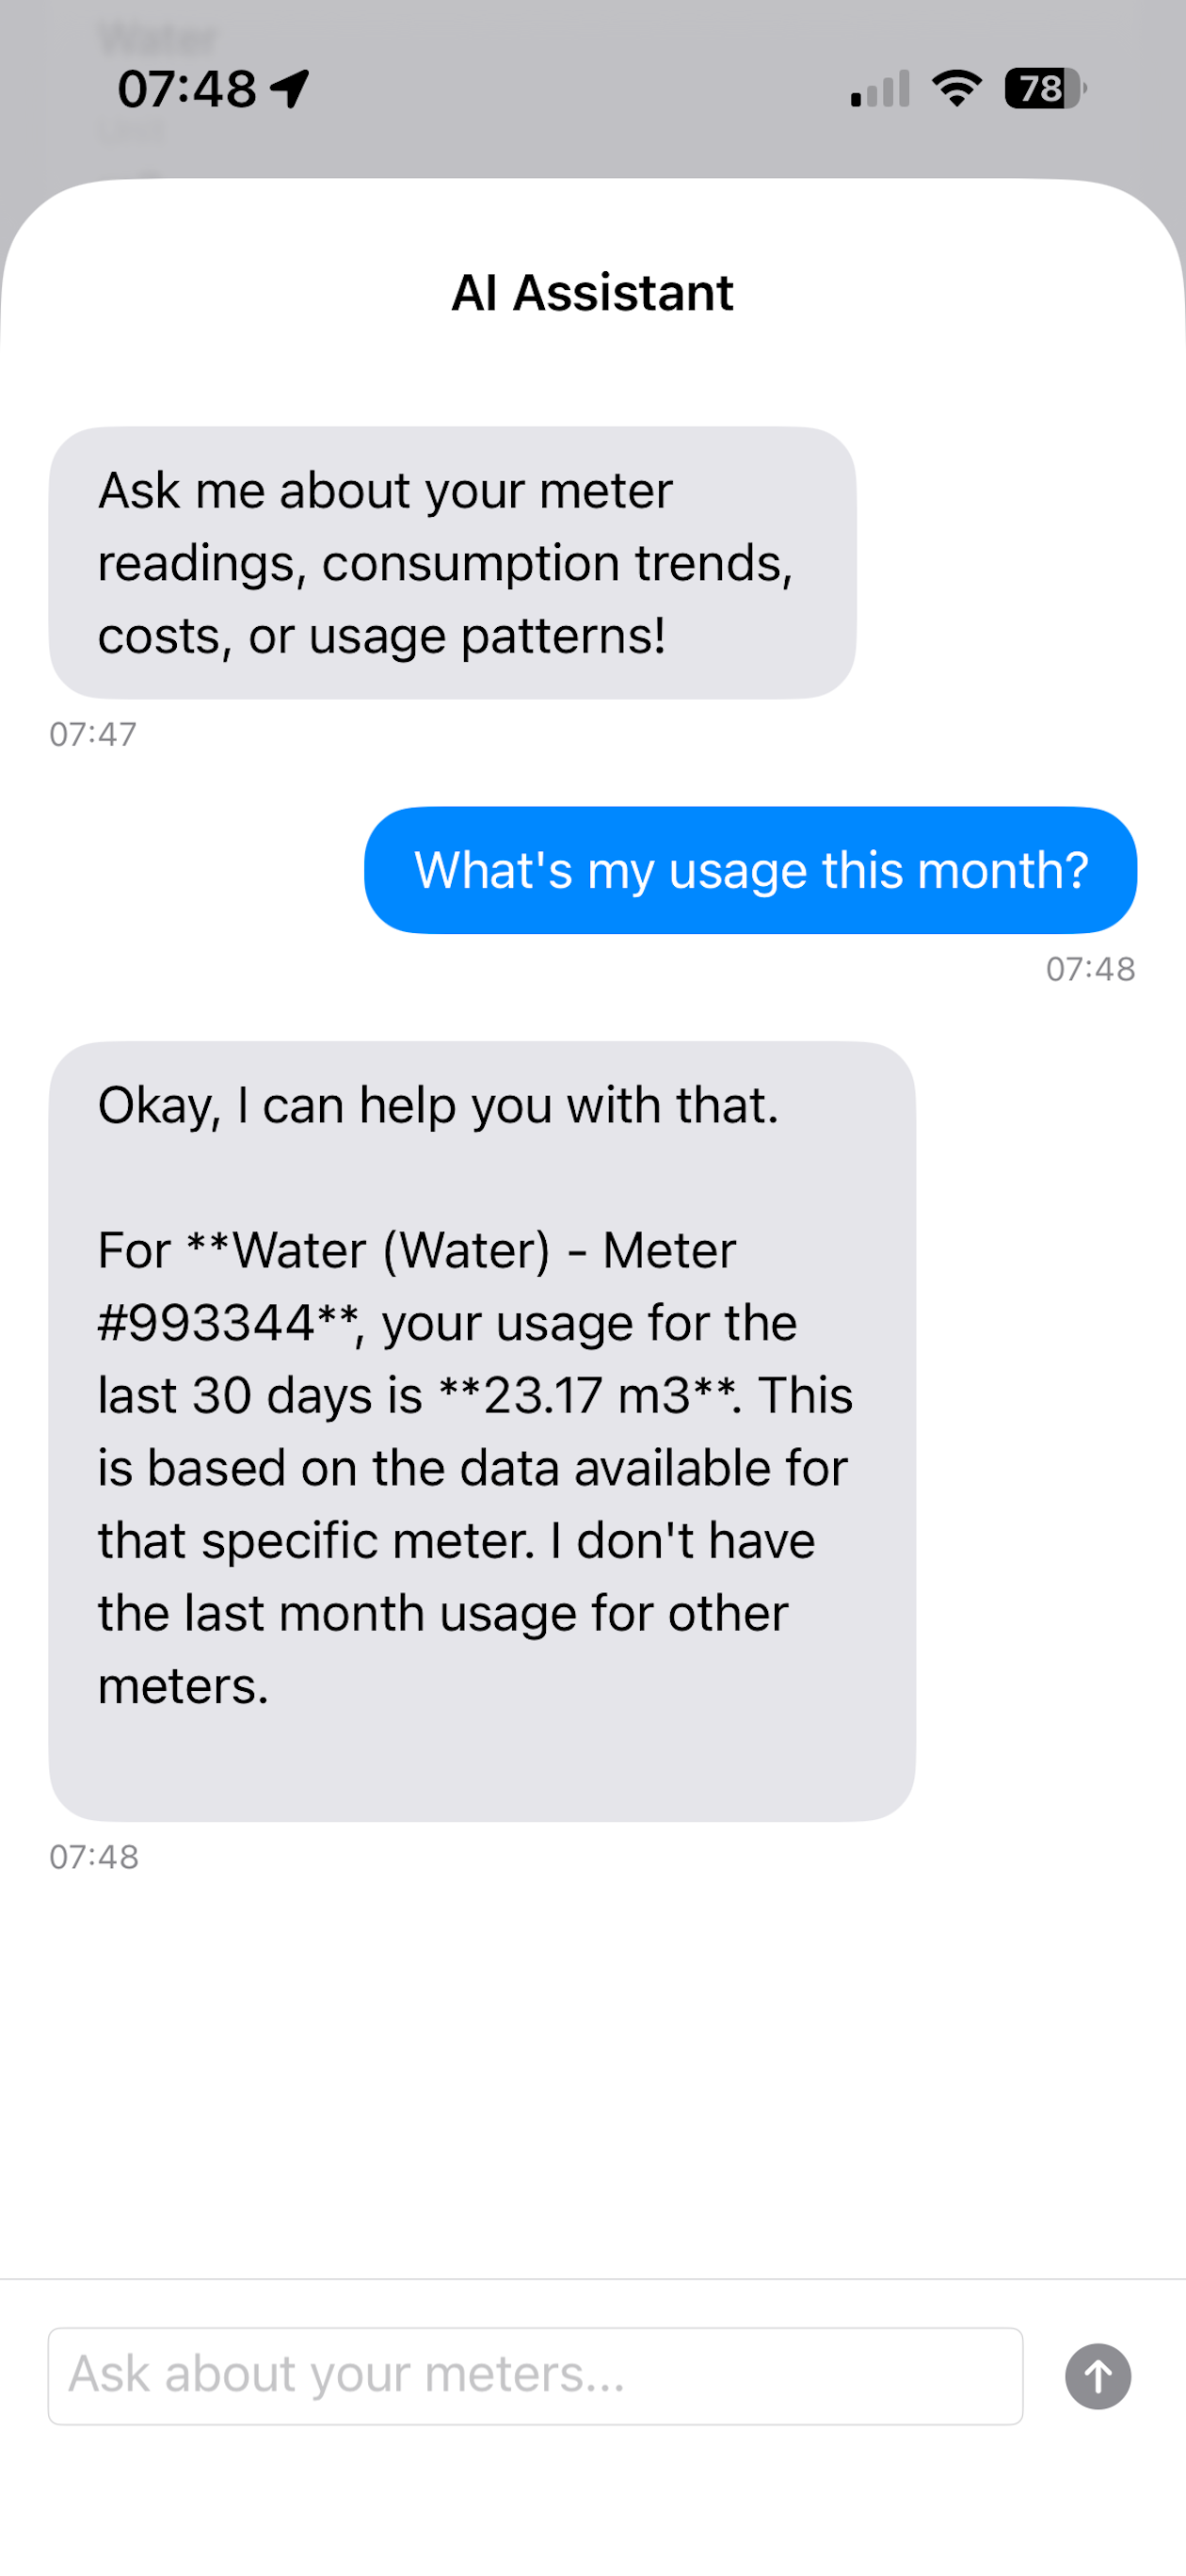
AI-Powered Assistant
Ask questions about your consumption in plain language. Get instant, intelligent answers powered by AI that understands your meter data.
- ✓ Ask questions like "What's my usage this month?"
- ✓ Get insights about consumption trends and costs
- ✓ Compare usage across different time periods
- ✓ Context-aware responses based on your actual data
- ✓ Quick questions with predefined prompts
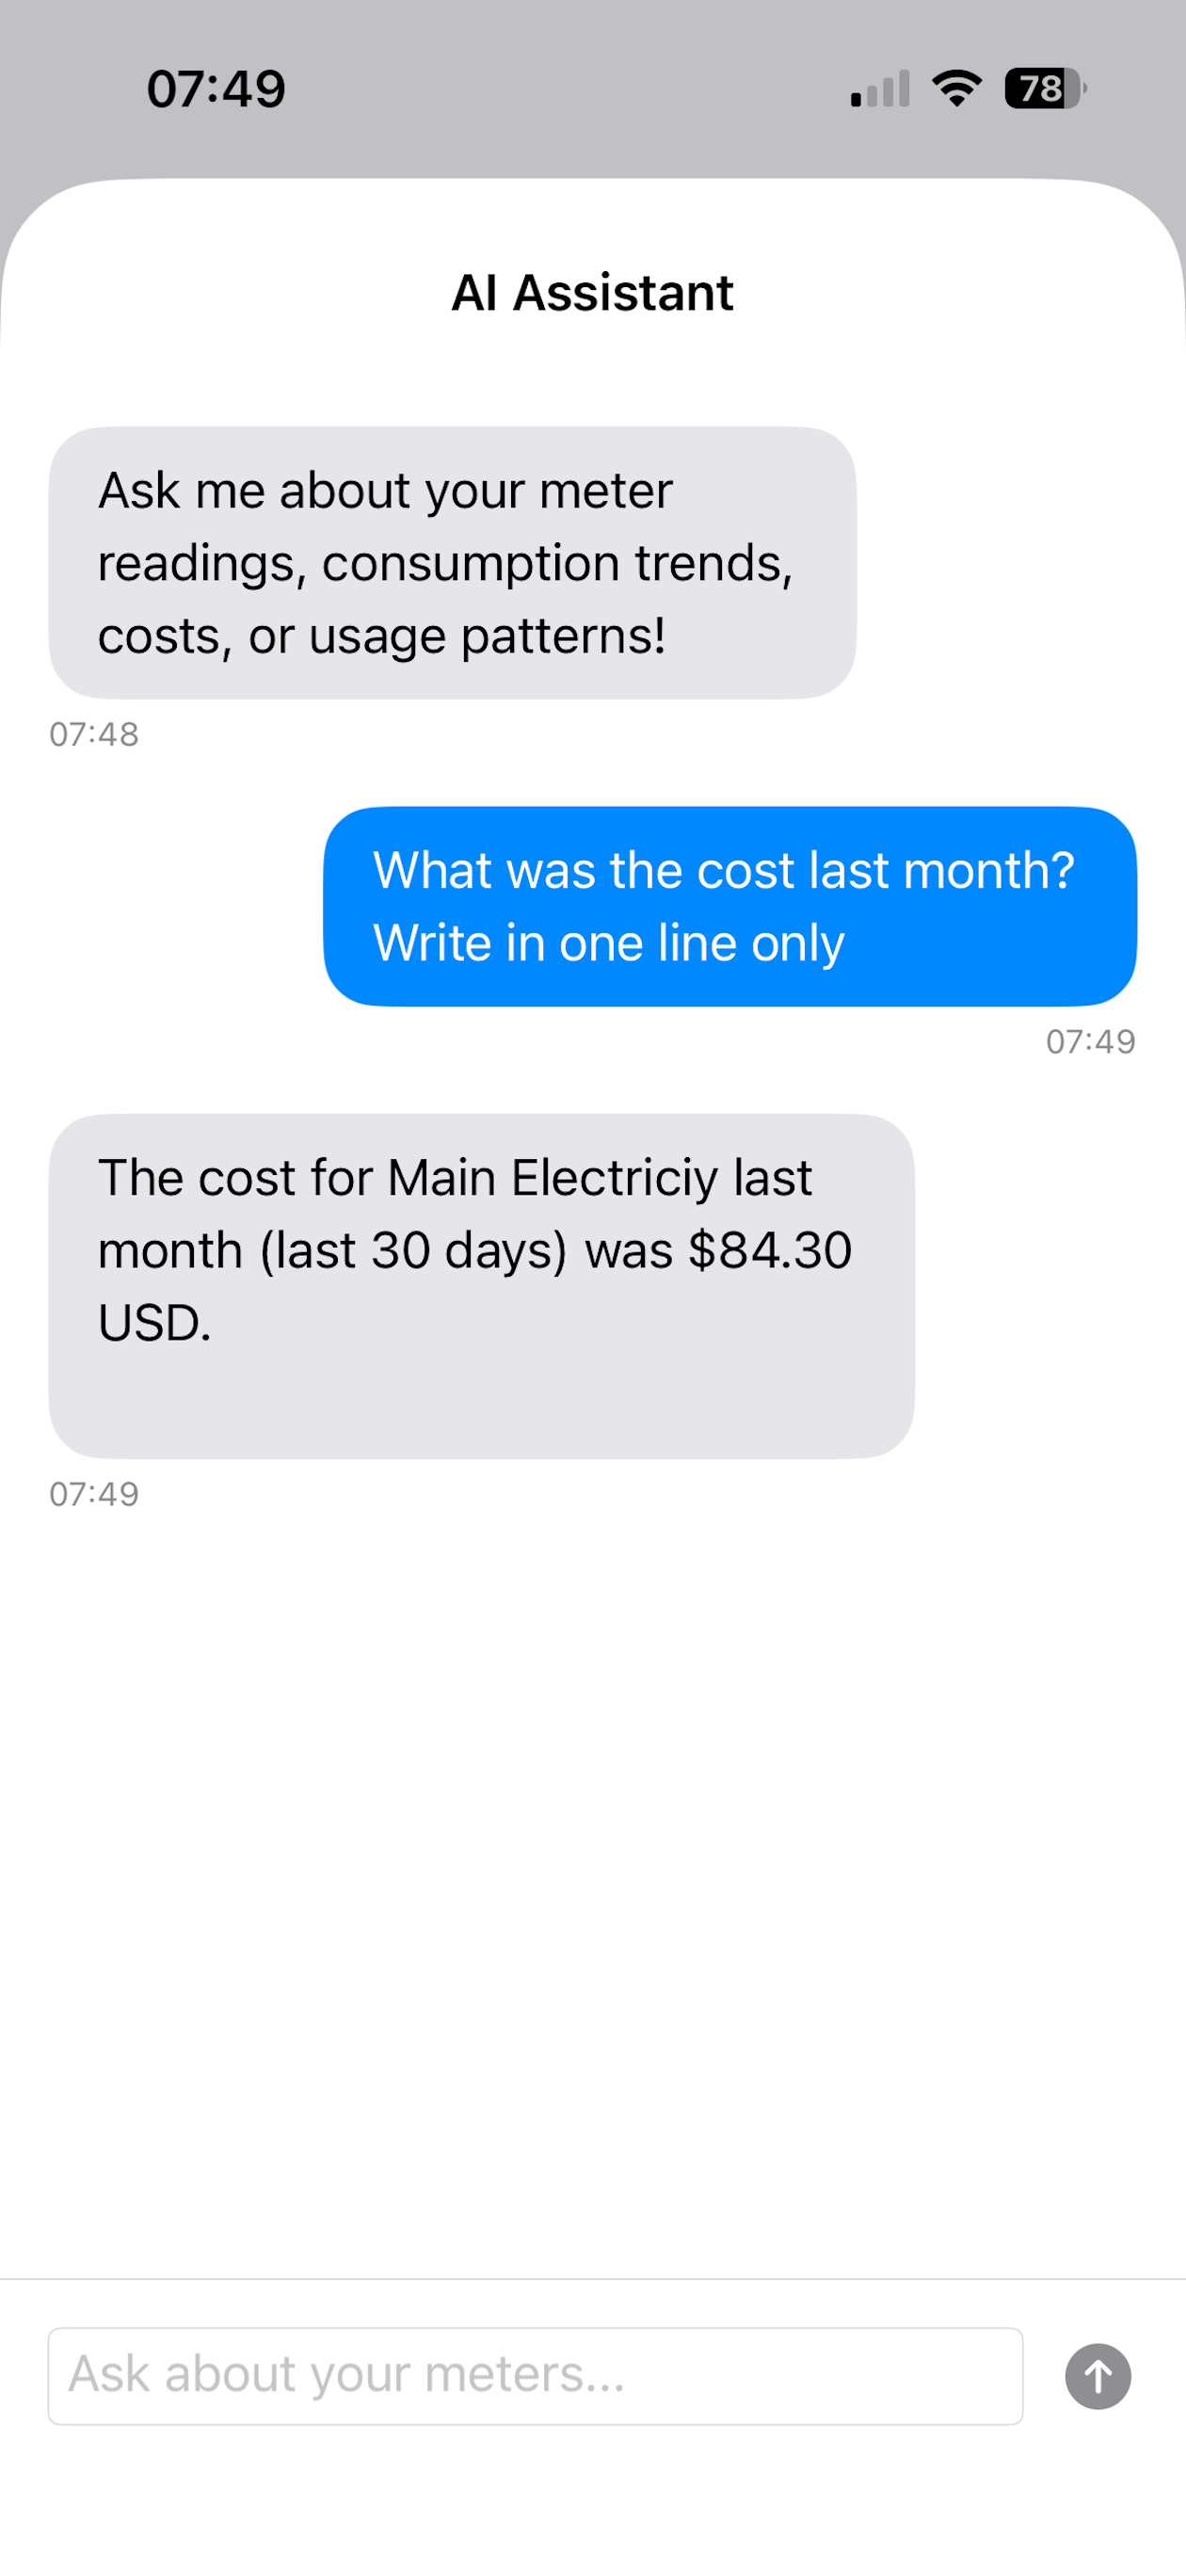
Smart Insights on Demand
Get personalized insights about your utility consumption. The AI assistant analyzes your patterns and provides actionable recommendations.
- ✓ Compare costs across different meters
- ✓ Identify which meters consume the most
- ✓ Understand consumption trends and patterns
- ✓ Get answers faster than manual analysis
- ✓ Natural language queries for easy interaction
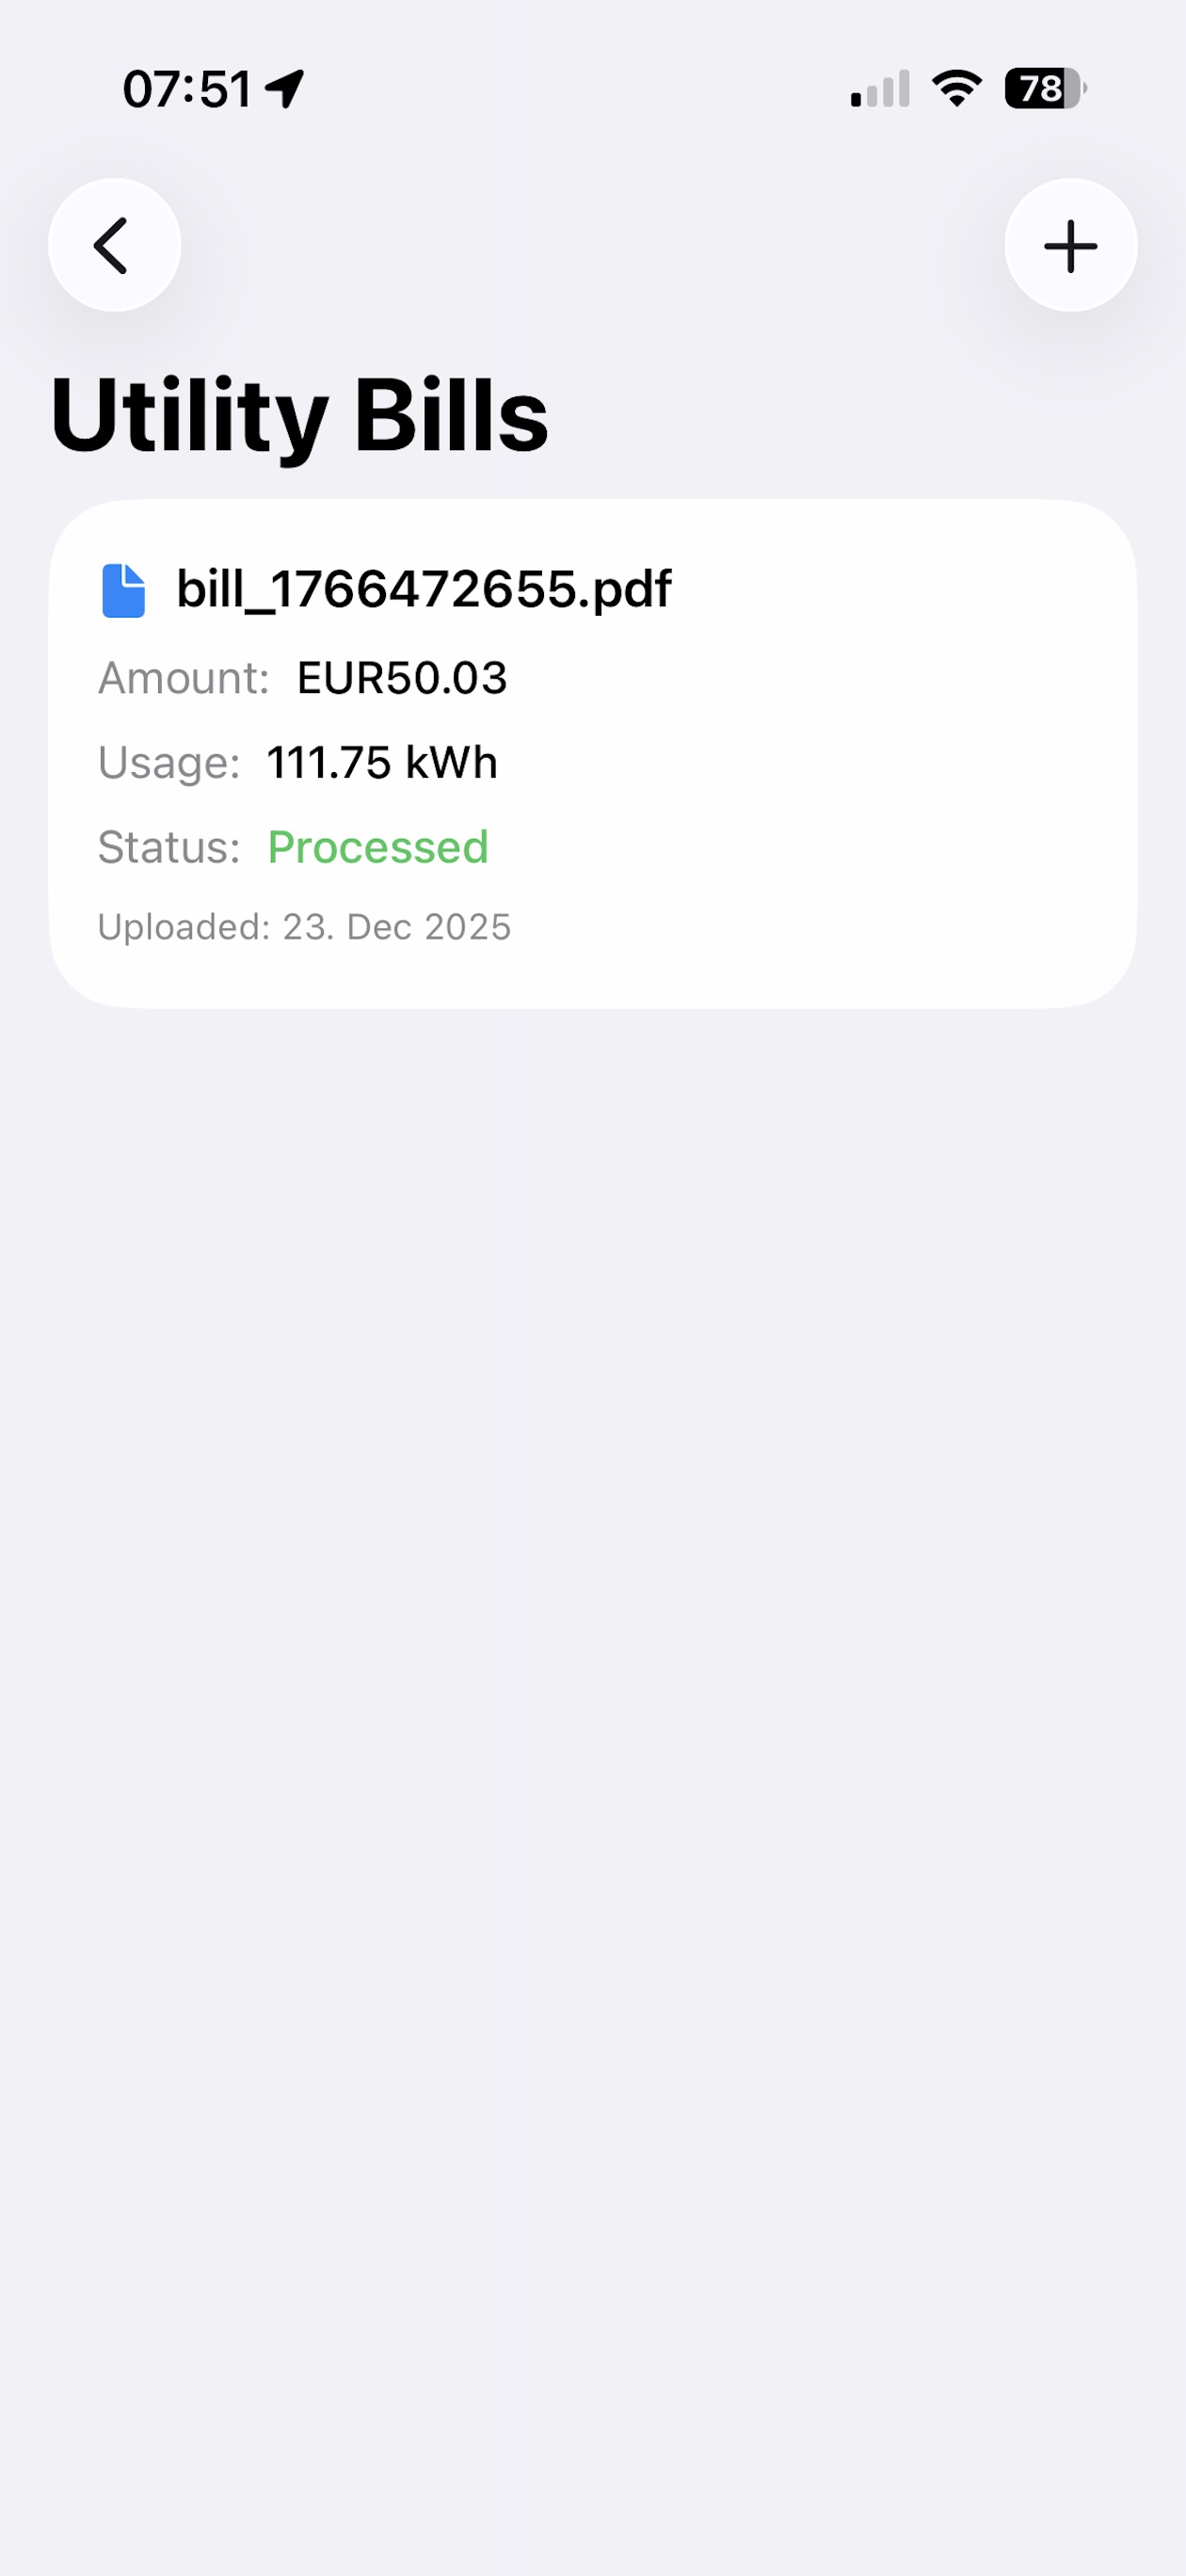
Smart Bill Management
Upload utility bills and automatically compare them with your meter readings. Catch discrepancies and verify billing accuracy.
- ✓ Upload bills with a simple photo or PDF
- ✓ Automatic OCR extraction of bill information
- ✓ Compare bill data with your meter readings
- ✓ Link bills to specific meters for tracking
- ✓ Identify billing errors and discrepancies
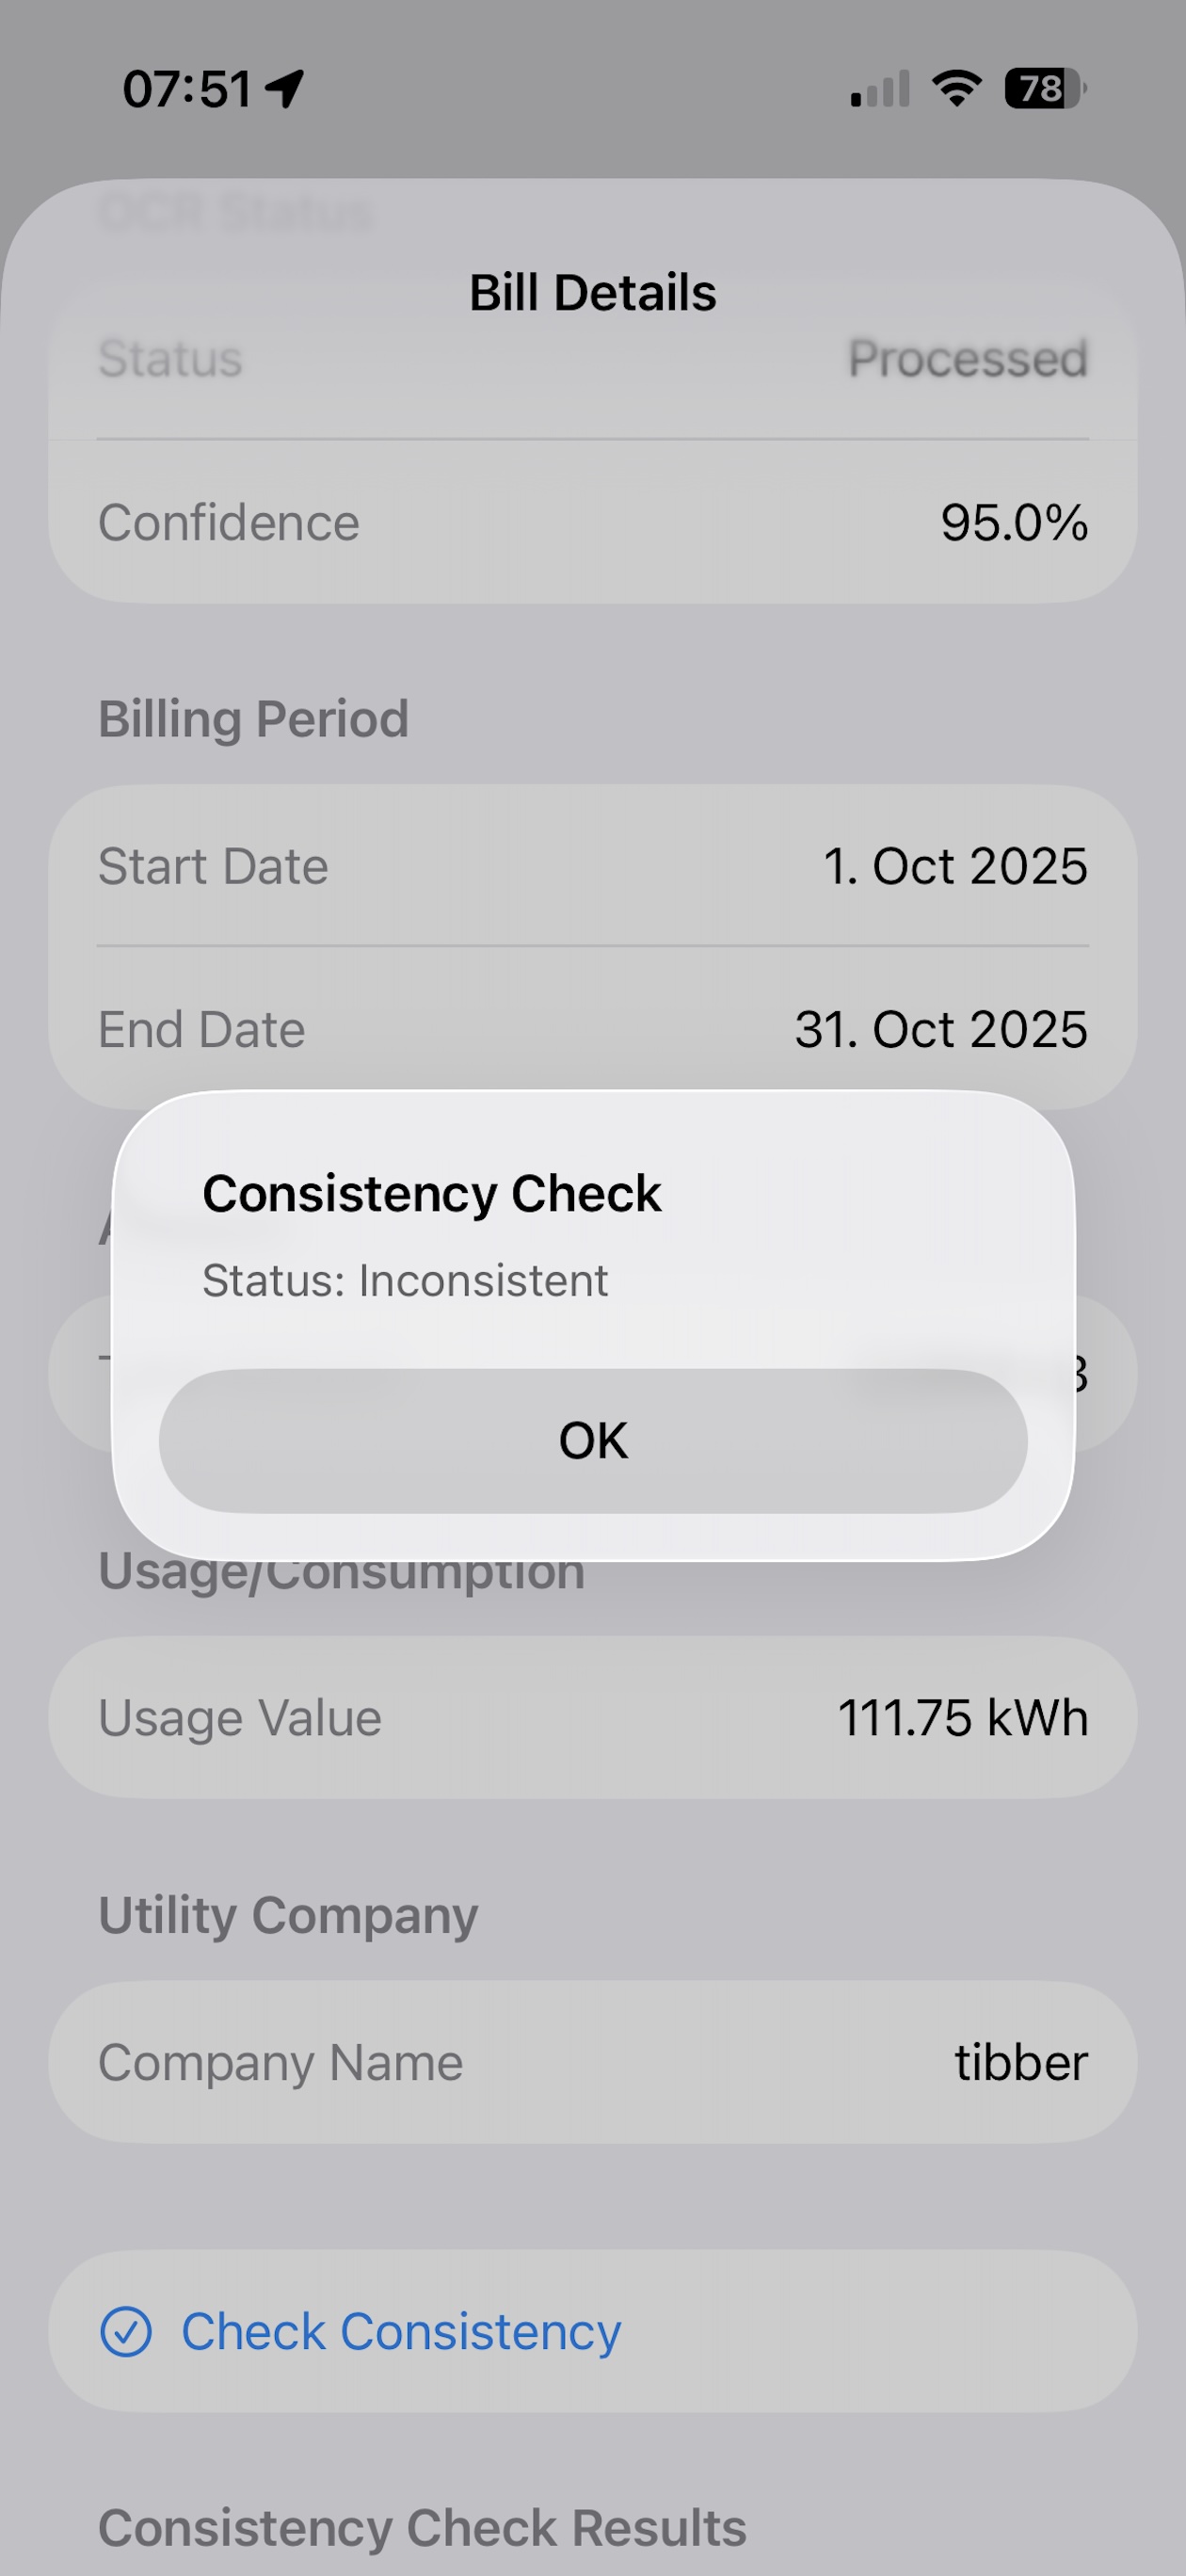
Automatic Consistency Verification
The AI assistant automatically checks consistency between your uploaded bills and meter readings, helping you catch errors and verify accuracy.
- ✓ Automatic comparison of bill data with meter readings
- ✓ Flag discrepancies and potential billing errors
- ✓ Verify usage values match your tracked consumption
- ✓ Confidence scoring for extracted bill data
- ✓ Easy review and correction of extracted information
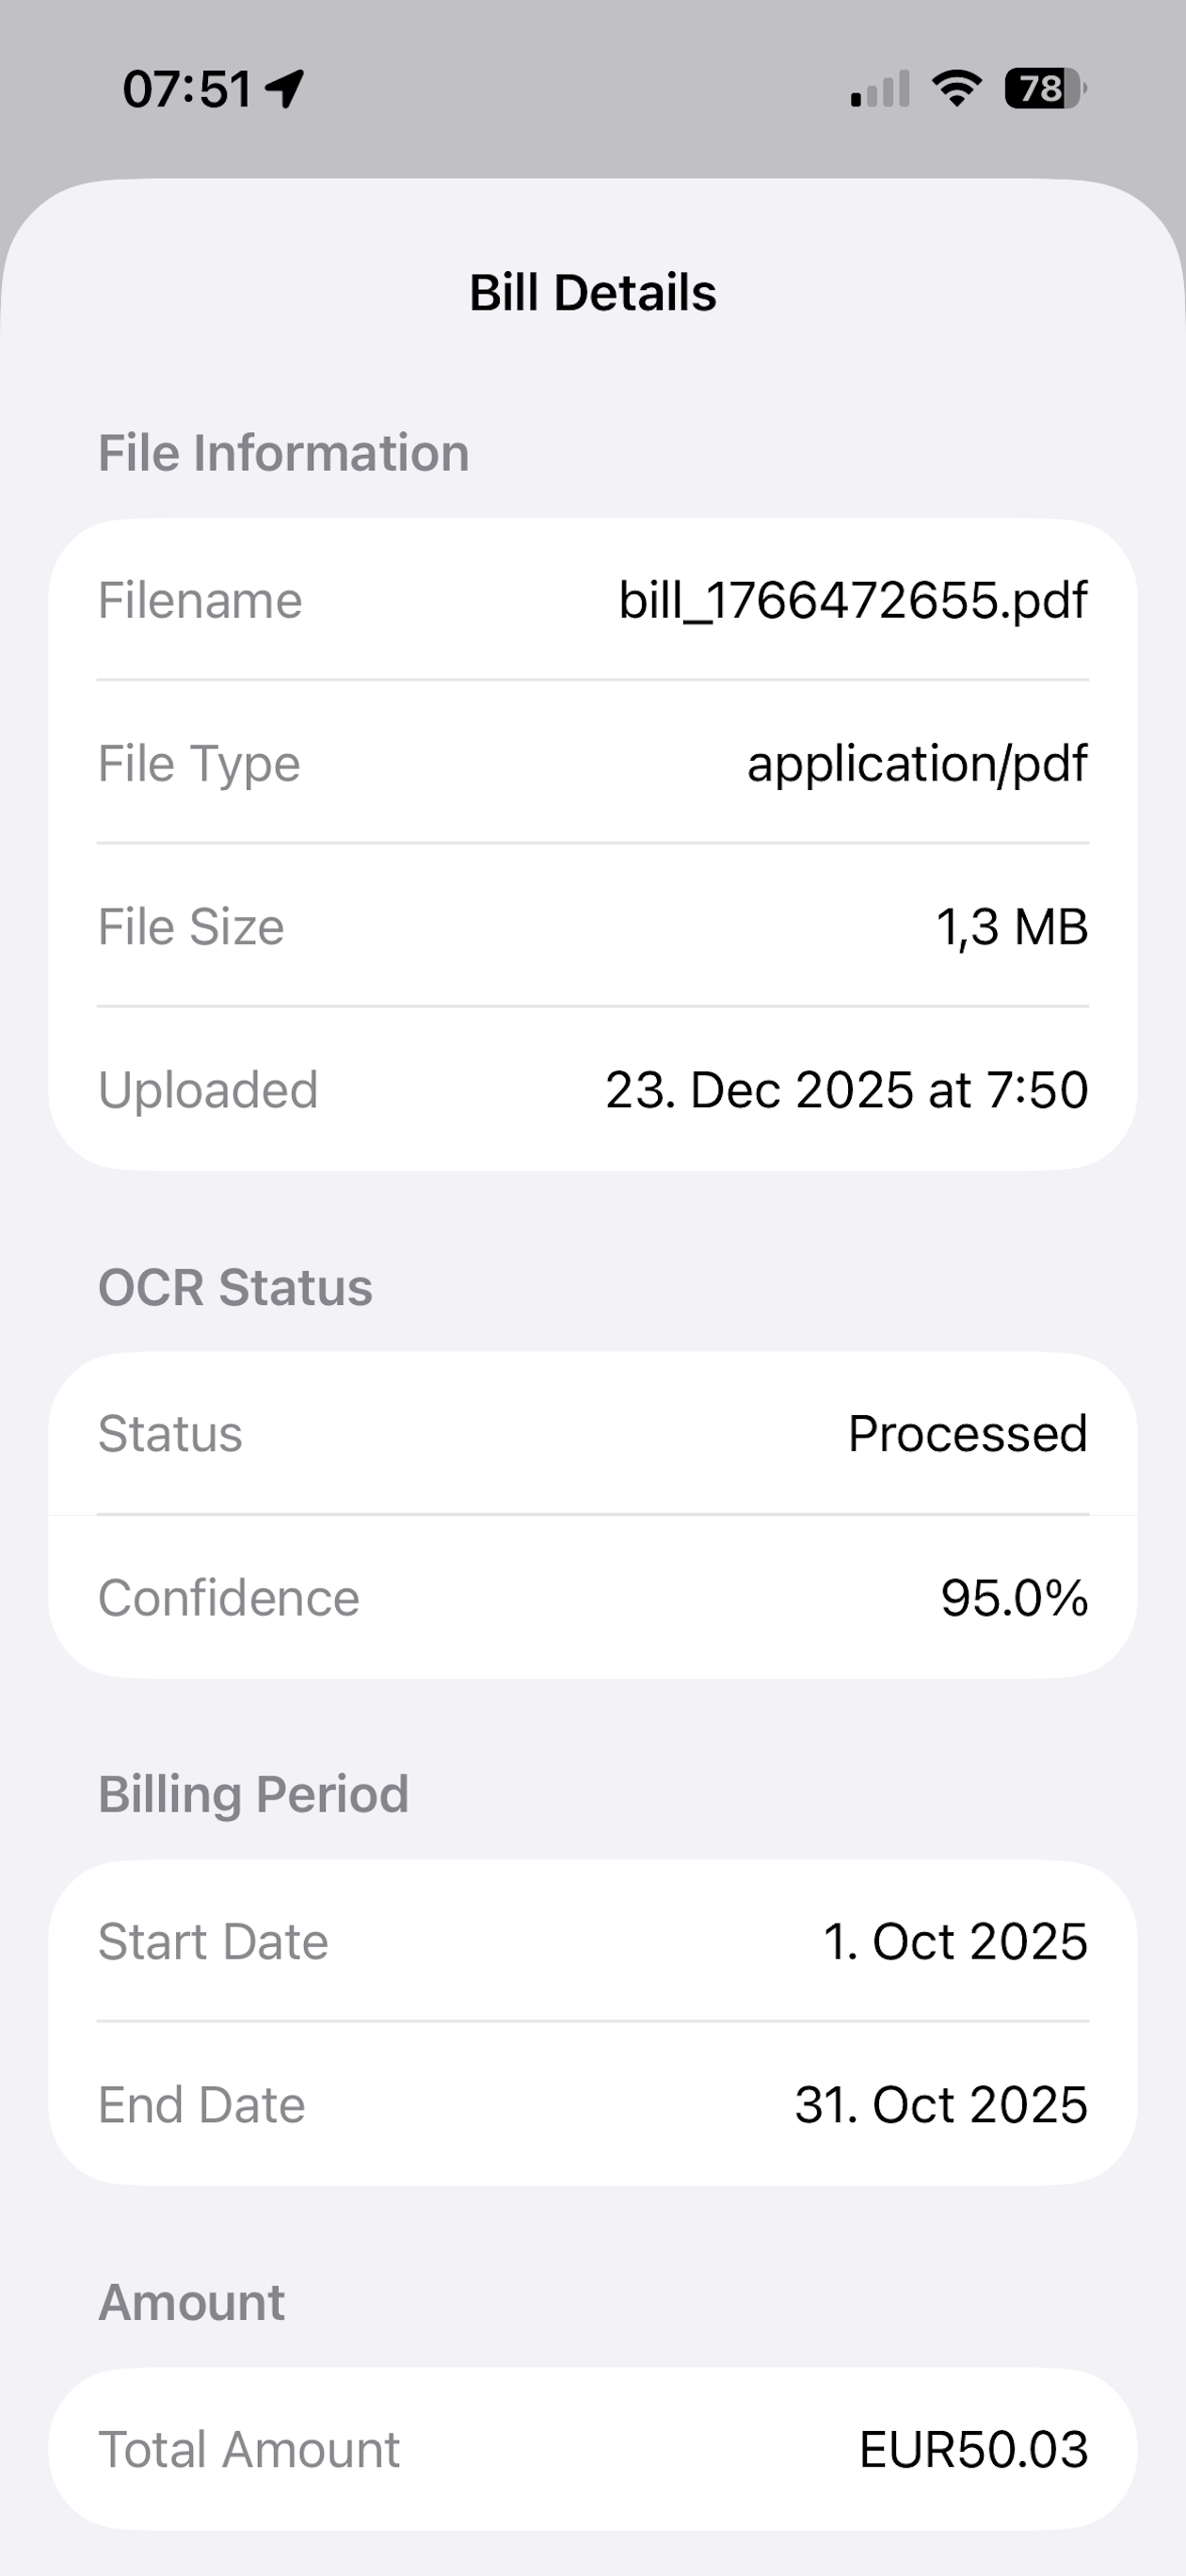
Advanced OCR Technology
Our advanced OCR technology automatically extracts key information from your utility bills, saving you time and reducing manual data entry.
- ✓ Extract dates, amounts, and usage values automatically
- ✓ Identify utility company and account numbers
- ✓ Capture billing period and due dates
- ✓ AI-assisted parsing for accurate data extraction
- ✓ Manual correction option for review and accuracy
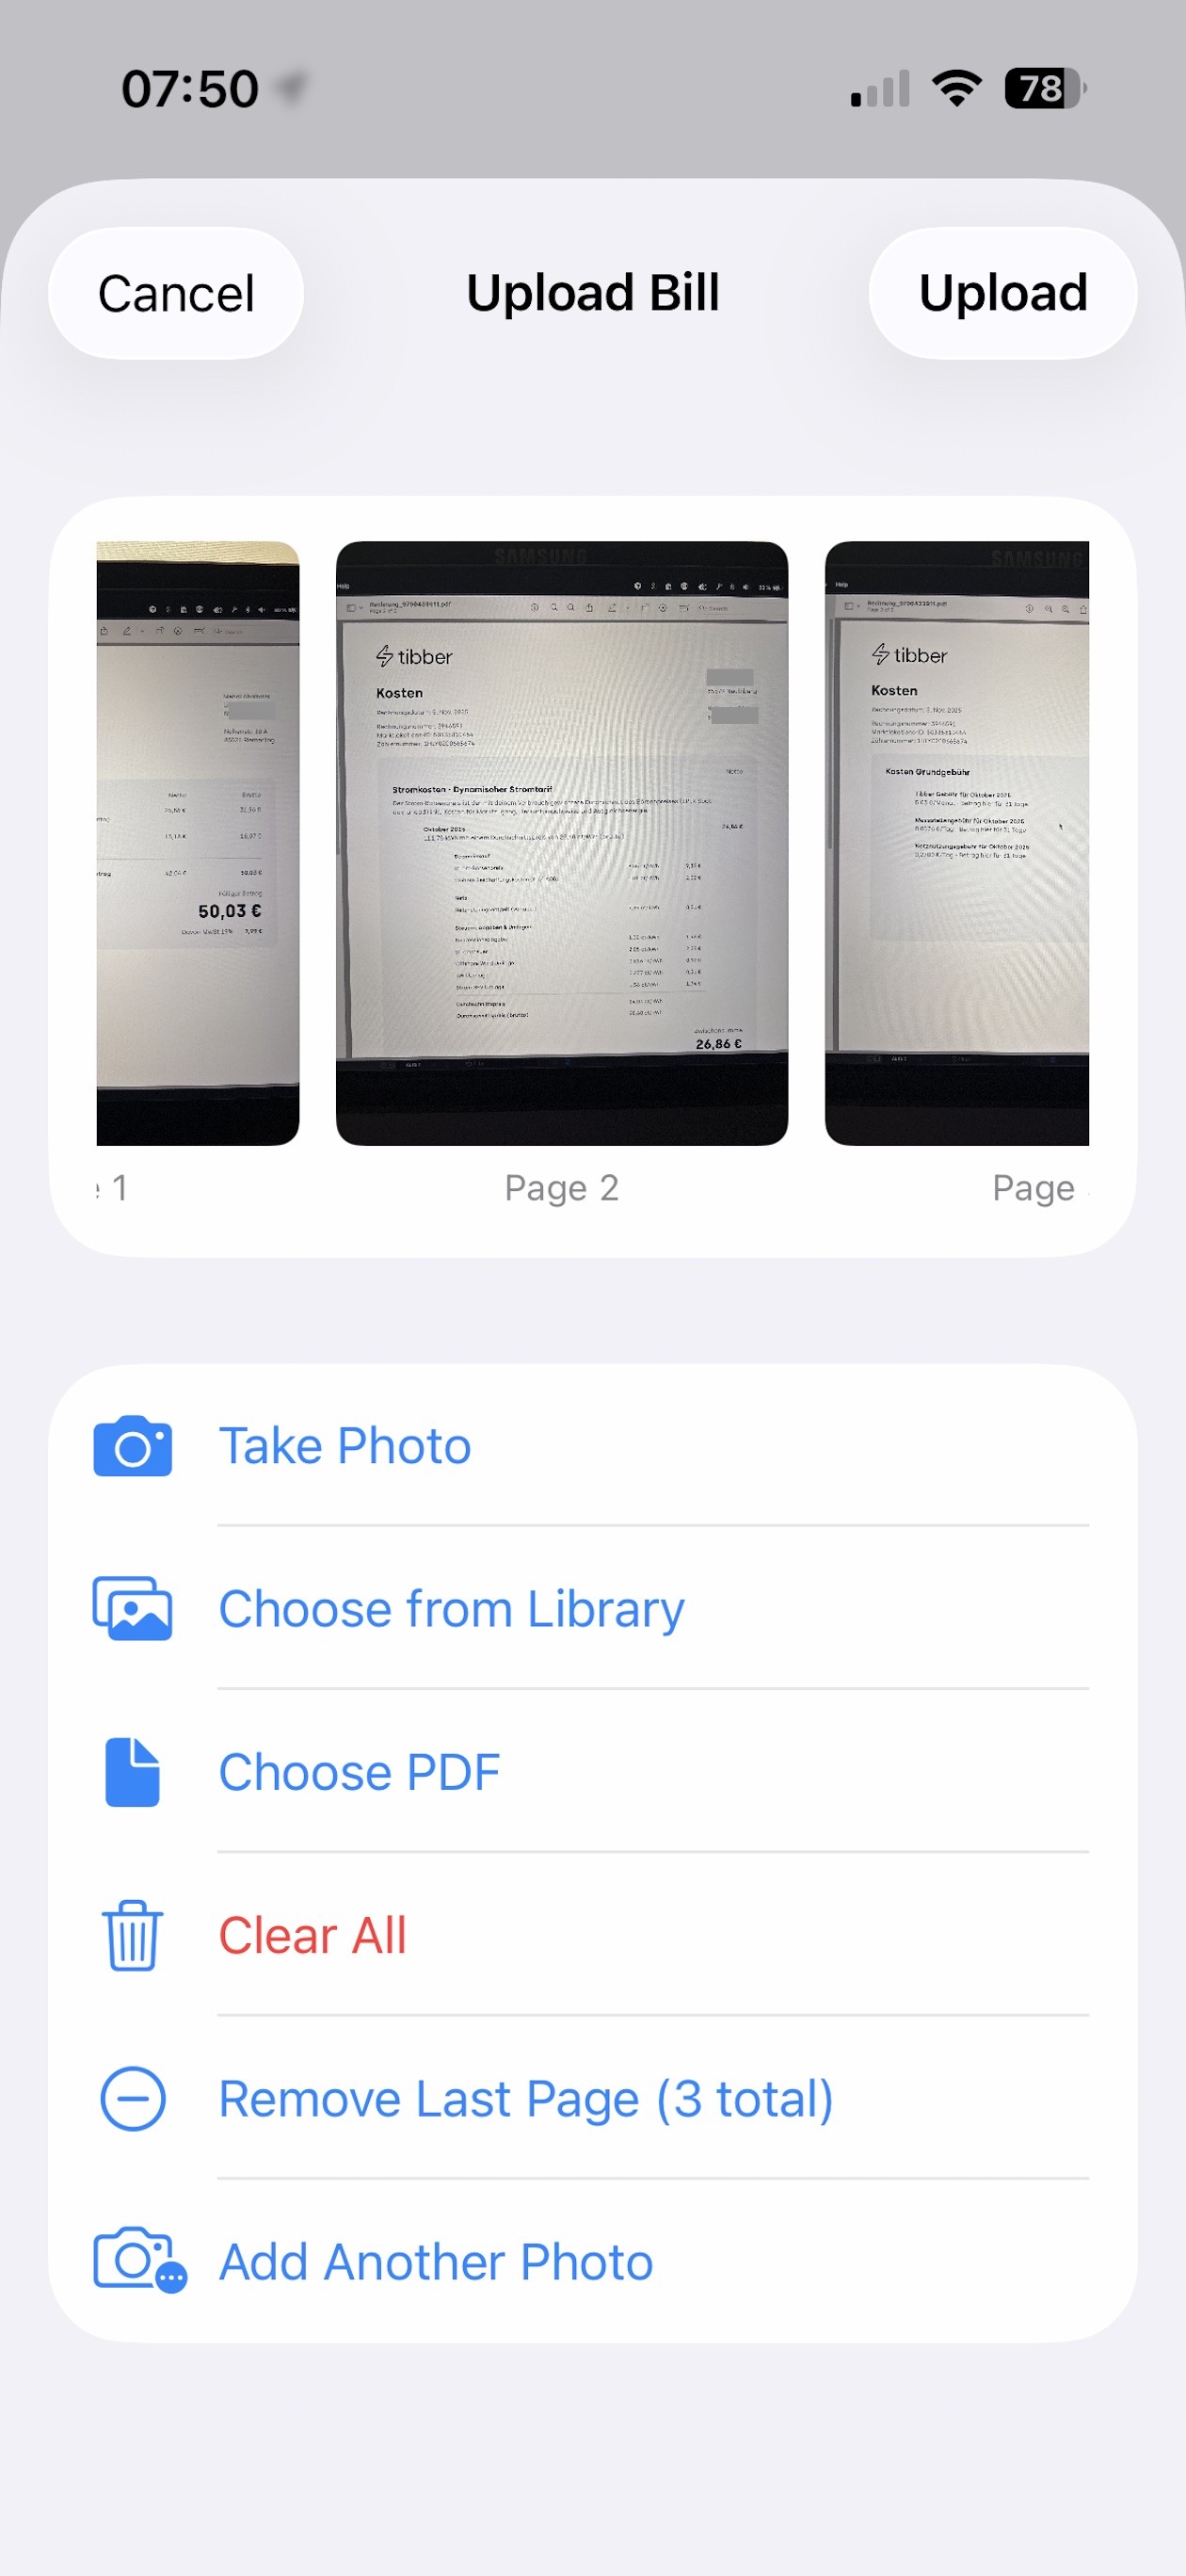
Multi-Page Bill Support
Upload multiple pages for each bill. The system processes all pages together, ensuring complete data extraction from multi-page utility bills.
- ✓ Upload multiple photos or pages per bill
- ✓ Automatic processing of all pages together
- ✓ Track upload status and processing progress
- ✓ View all bills linked to each meter
- ✓ Complete bill history and management
Available on Multiple Platforms
Access UtilityControl from any device. All platforms sync seamlessly, so your data is always up to date.
iOS App
Track utilities on the go with our lightweight iOS app for iPhone, iPad, and Mac.
Android App
Android version coming soon. Stay tuned for updates.
How It Works
UtilityControl helps you track, analyze, and optimize utility consumption across multiple locations. With AI-powered insights, interactive analytics, and automated bill processing, you can manage electricity, water, gas, and heating meters from one intuitive platform.
Set Up Locations & Meters
Create locations for your properties and add meters for electricity, water, gas, or heating. Configure each meter with units, costs, and descriptions.
Record Readings
Enter meter readings manually or import bulk data via CSV. The system automatically calculates daily consumption using intelligent interpolation.
Analyze & Get Insights
View interactive charts showing consumption trends and costs. Ask the AI assistant questions about your usage patterns, or upload bills for automatic comparison with meter readings.
Export & Optimize
Export data to CSV for reporting or integration. Use insights to identify cost-saving opportunities and optimize your utility consumption.
Learn More About Utility Management
Explore our blog articles to learn more about utility tracking, energy management, and best practices.
How AI is Revolutionizing Utility Bill Management
Discover how AI and OCR technology are transforming utility bill management in 2025, saving time and reducing errors.
Read Article →Utility Tracking for Rental Properties
Learn why utility consumption tracking is critical for property managers and how it prevents costly disputes.
Read Article →Utility Tracking Apps Comparison 2025
Compare the best utility tracking apps. Review features, pros, and cons to find the right solution for your needs.
Read Article →How to Track Building Energy Usage
A comprehensive guide on tracking building energy usage, covering methods and best practices for facility managers.
Read Article →Ready to Start Managing Your Utilities?
Get started with UtilityControl today and gain insights into your utility consumption
Start Free View Pricing Download iOS AppLast updated: Jun 2026